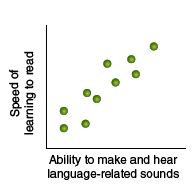
This research study found that kindergarten and elementary school children who were better at rhymes and hearing the sounds of individual letters before they started to read later learned to read words more quickly than children who were not as good with making and distinguishing elementary sounds of language.
Choose the scatterplot below that is most consistent with the results of this correlational study.
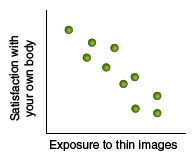
Researchers found that the constant exposure to mass media (television, magazines, websites) depicting atypically thin, glamorous female models may be linked to lower body confidence for women. The general finding was that the more women were exposed to pictures and articles about thin females, the lower their satisfaction was with their own bodies.
Choose the scatterplot below that is most consistent with the results of this correlational study.
Ninth-grade students and teachers were surveyed to determine the level of bullying that the students experienced. The researchers were given permission to access the scores of the students on several standardized tests, with topics including algebra, earth science, and world history. The researchers found that the more bullying a student experienced, the lower the student's grades on the standardized tests.
Choose the scatterplot below that is most consistent with the results of this correlational study.